Budget 2016: One simple chart that shows who benefits most – and who loses out
There are significant give-aways for the biggest earners, while the poorest get a mixed bag
Sign up for the View from Westminster email for expert analysis straight to your inbox
Get our free View from Westminster email
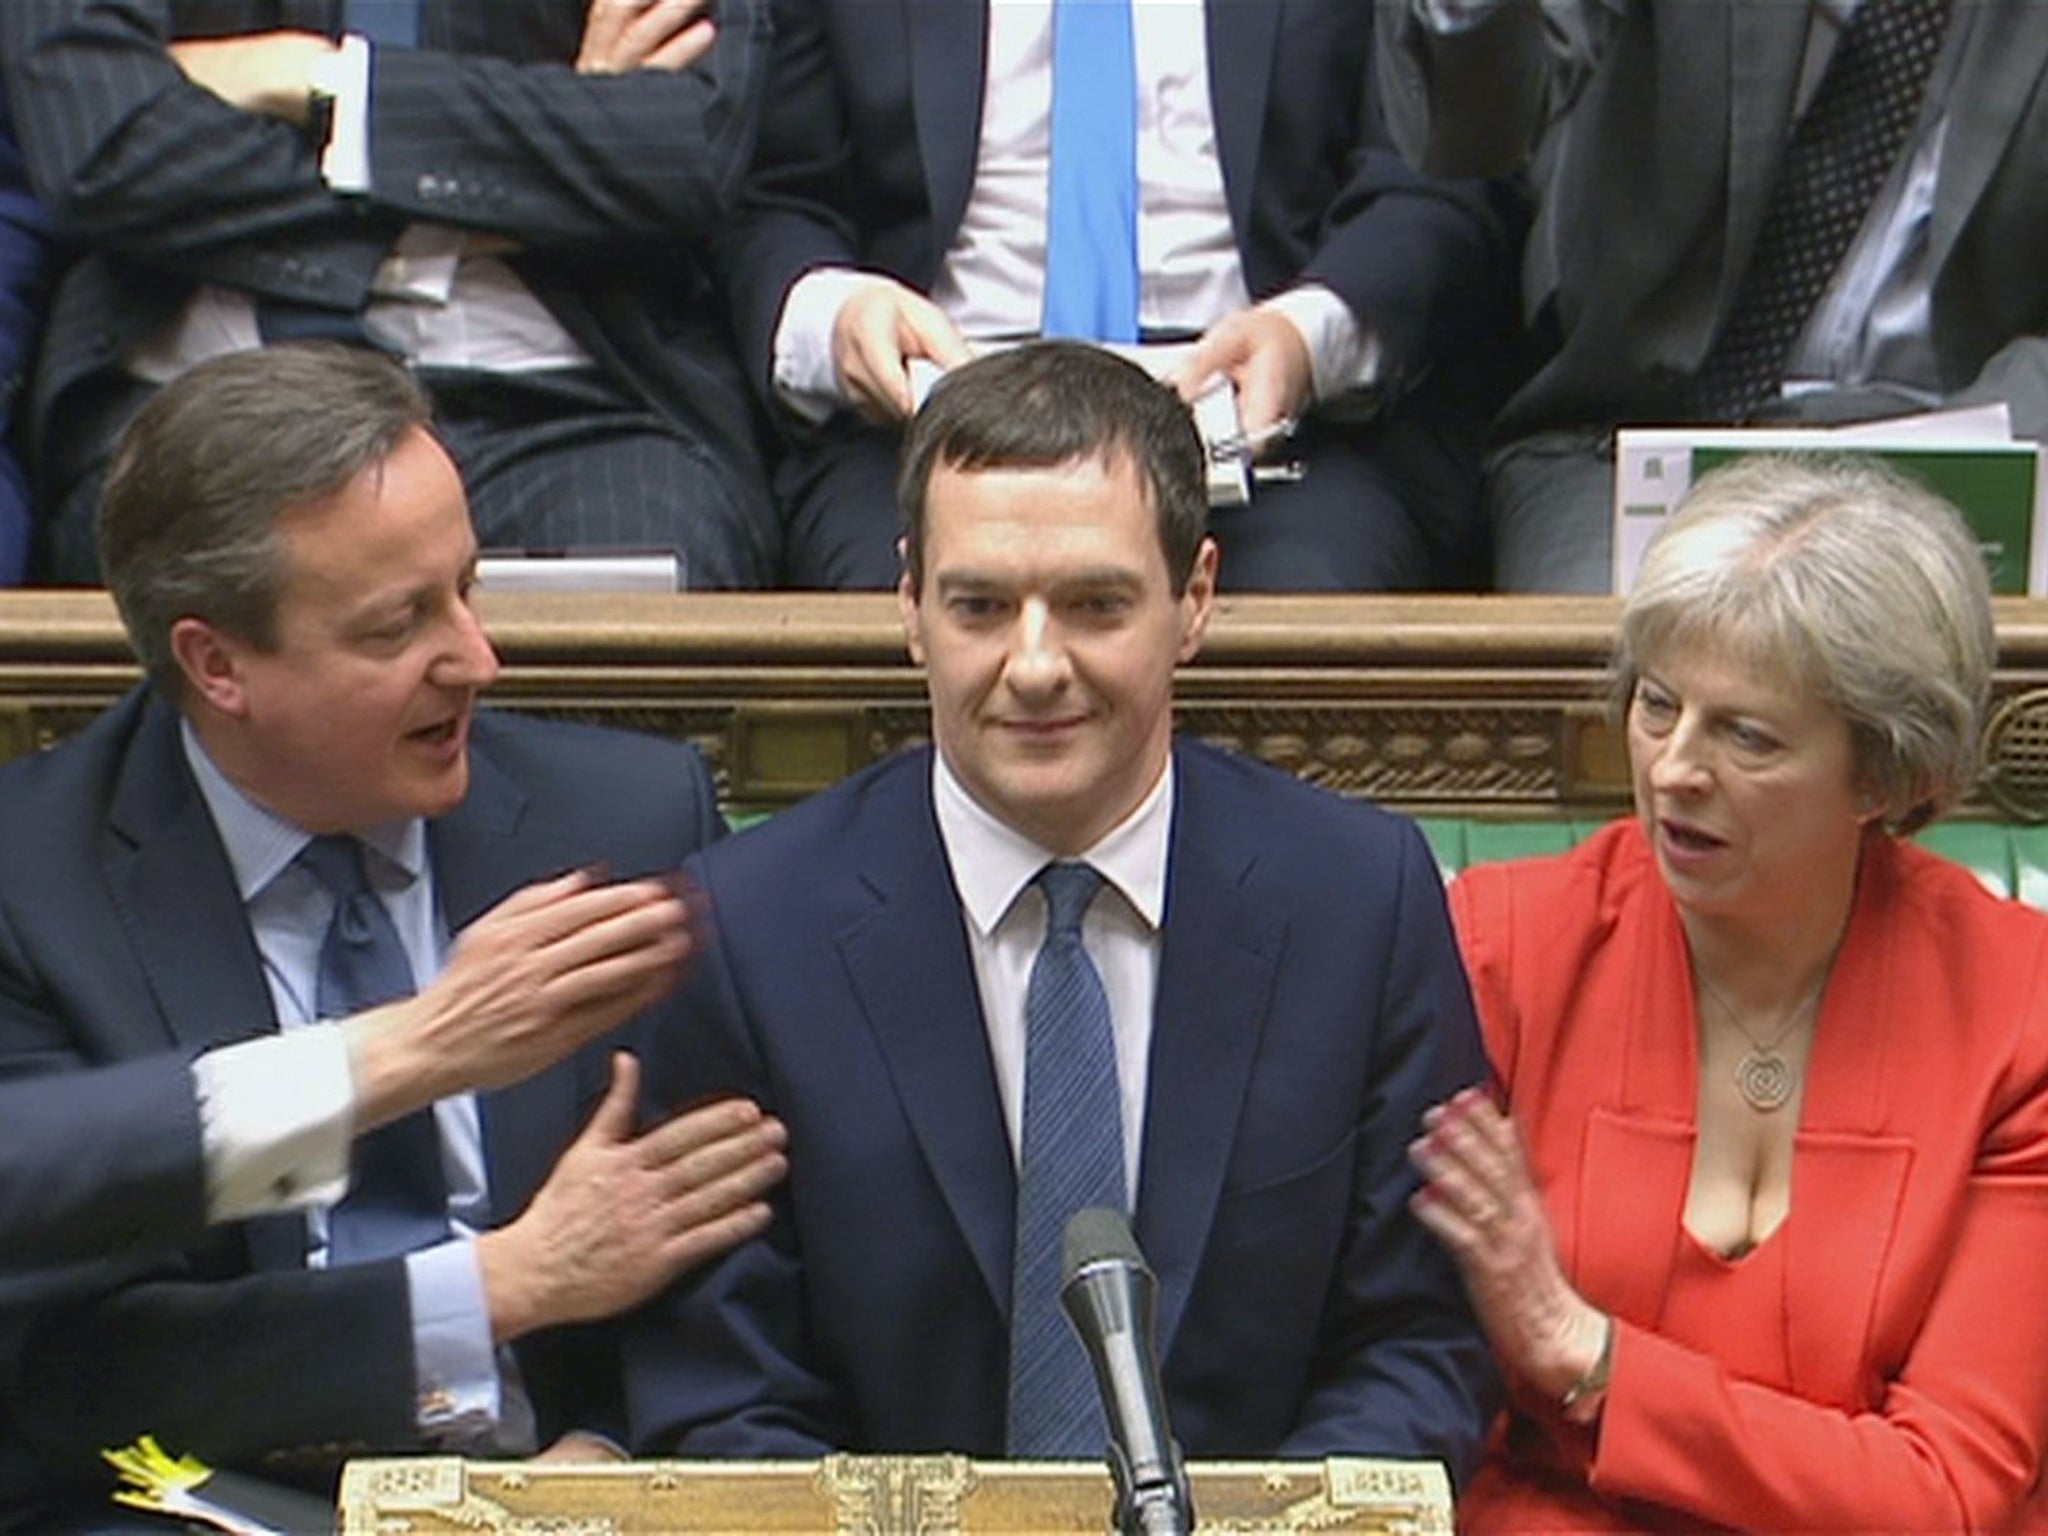
George Osborne’s Budget measures offer tax give-aways for the richest members of society in Britain, but do nothing to offset the harm to poorer people imposed since the Conservatives won the election.
That’s the verdict of the influential Institute for Fiscal Studies, which has put forward its analysis of the policies the Chancellor announced in Parliament on Wednesday.
In its analysis of how Mr Osborne’s reforms will impact people in different incomes, the IFS found there would be noticeable gains for the top 50 per cent of earners – and almost no net impact on the poorest half.
In the graph above, the yellow bars show the impact of Wednesday’s Budget in the context of all the tax and benefit reforms made by the Tories coming into effect during this Parliament.
It shows the very richest 10 per cent of earners have benefitted by far the most from Mr Osborne’s announcements.
Andrew Hood, an economist with the IFS who co-authored the analysis, told The Independent: “These weren’t trivial giveaways to those at the top of this graph.”
He said the most significant policies were the raising of the income tax threshold and the 40p top rate of tax – naturally helping the richest in society because “lots of lower earners don’t pay income tax at all, so don’t benefit”.
Those in the bottom deciles shown on the graph do benefit from the freezes to fuel duty and alcohol duty, Mr Hood said.
George Osborne 2016 budget at a glance
Show all 8But those gains are completely wiped out by the cuts to Personal Independence Payments for disabled people.
That’s where Mr Osborne’s most controversial policy – aside from the distraction of the sugar tax – comes into play on the graph.
Despite what the Chancellor has tried to claim, Mr Hood said “the cut to PIP is significant”.
“It affects a relatively small number of people – around 300,000 – but the effect for those people is likely to be pretty significant,” he said.
As a result, the graph shows the Budget carries almost no benefit at all for anyone in the bottom half of UK earners, once the hit to PIP has “offset” the fuel and alcohol duty freezes.
The green bars on the graph show the effects of all the economic policies introduced by the Tories since they came into power last year, before those introduced this week.
“This graph is most informative because it puts the Budget into context,” Mr Hood said. “In the broader context of everything the Government is planning to do, the impact from yesterday is really quite small.”
The large downward bars show the losses of annual income for almost every strata of society, but these are most pronounced for lower earners.
This is largely down to the previously announced £12 billion of welfare savings, which were a key part of the Conservative election manifesto.
Subscribe to Independent Premium to bookmark this article
Want to bookmark your favourite articles and stories to read or reference later? Start your Independent Premium subscription today.
Join our commenting forum
Join thought-provoking conversations, follow other Independent readers and see their replies